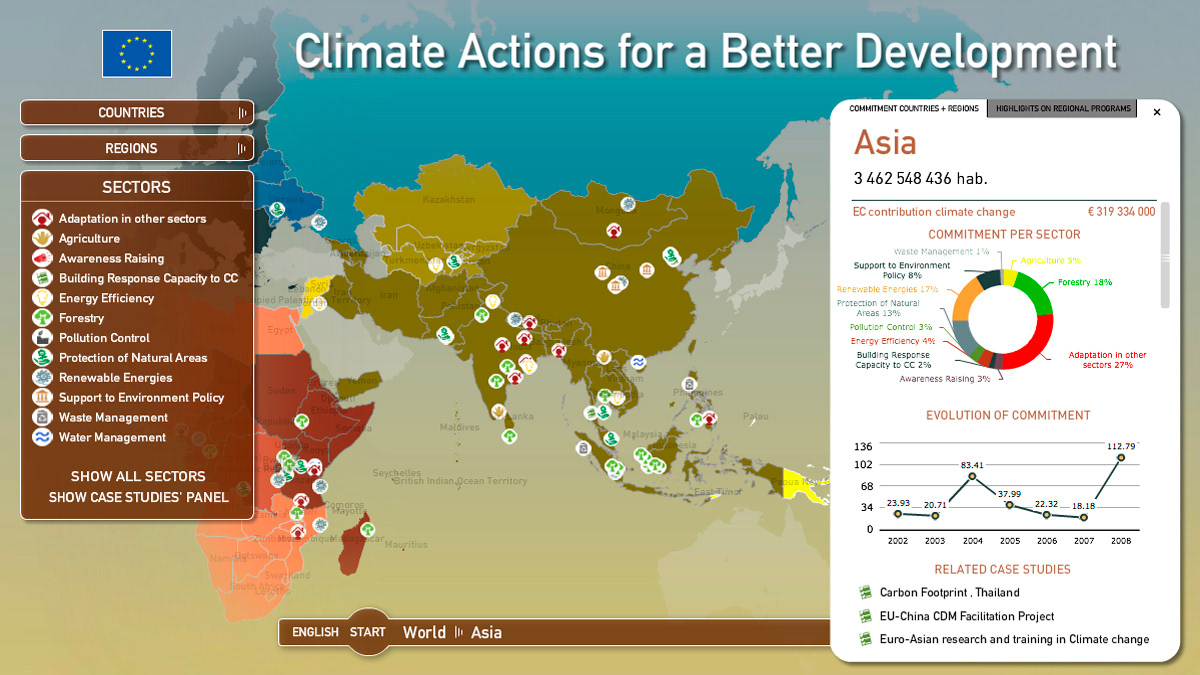
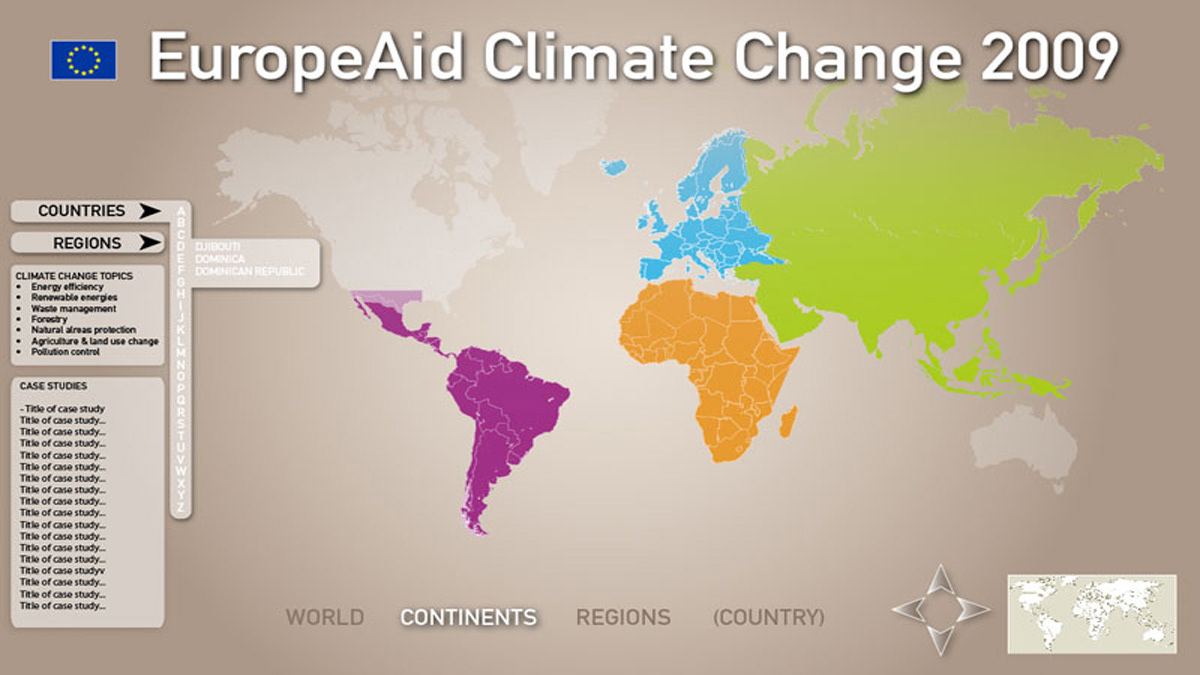
Creative and technical direction of a Flash-based interactive world map specifically designed for touch screens and for European Commission’s EuropeAid’s website...
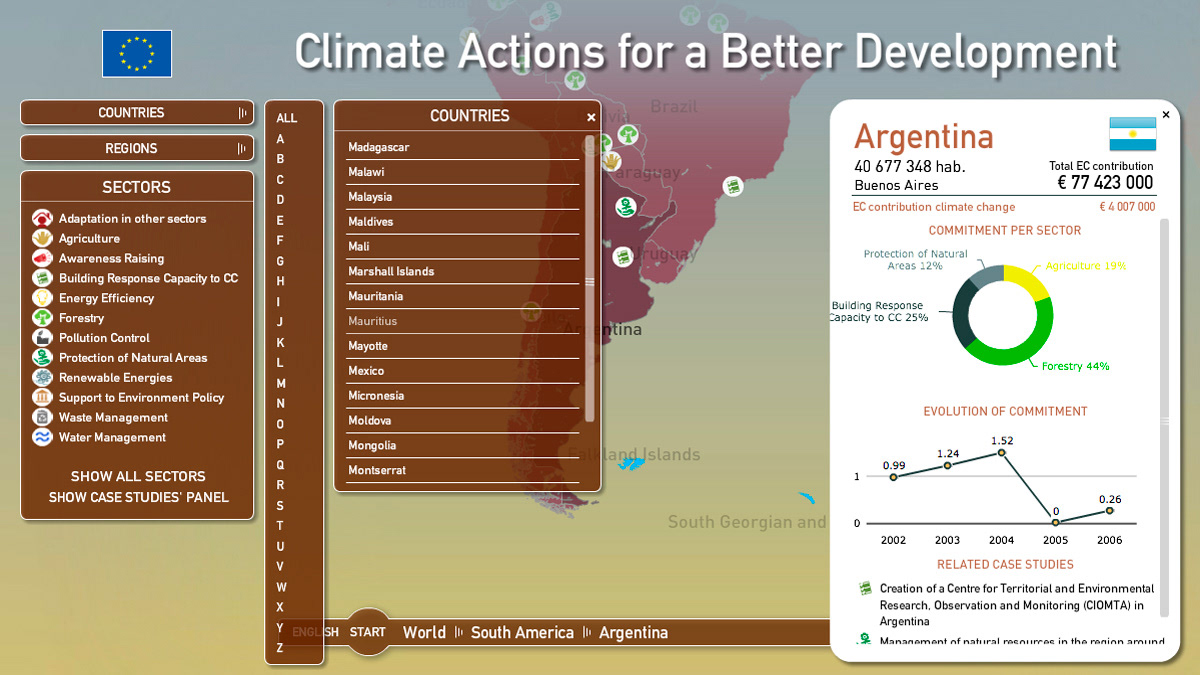
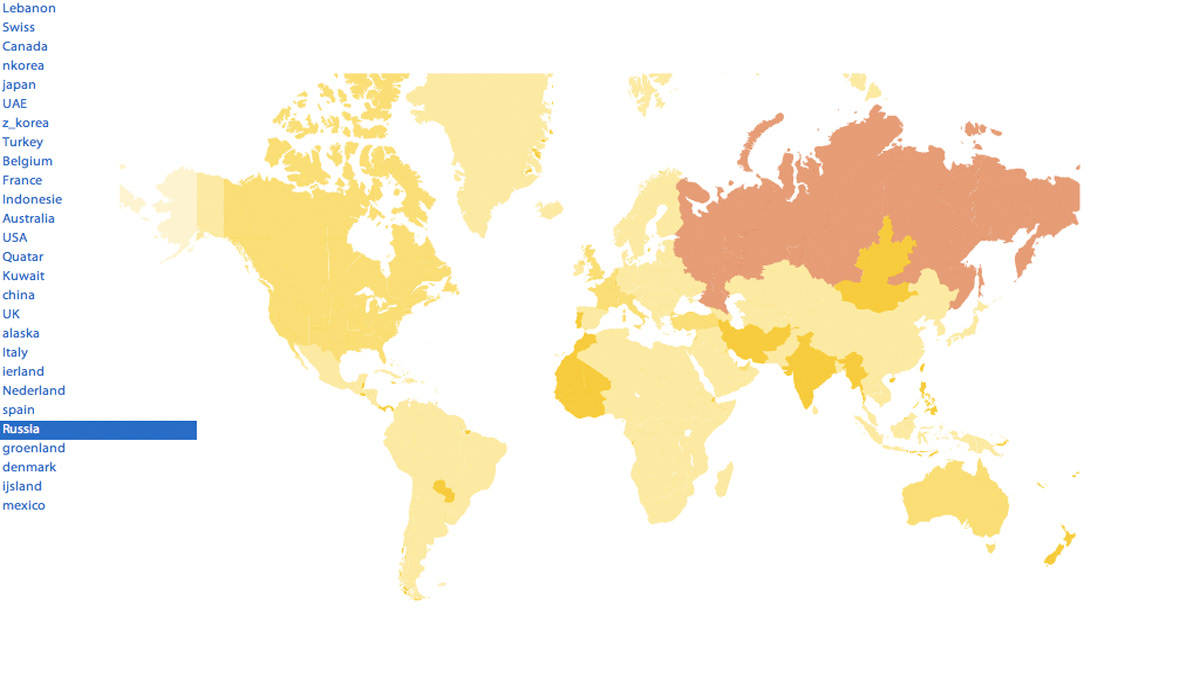
... offering users a dynamic experience with data that can be read on several levels, both geographical (continent, country, region) and thematic (e.g. agriculture, forestry). The charts are not predrawn, they consists of a engine that redraws the chart each time there is an update to the data.
See the presentation on line: http://www.branislavmilic.com/portfolio/applications/europeaid-interactive_map/index.html
If you are reading this page from an iOS device or on a device without the Flash plugin, you can see here a video demo of the presentation: http://www.branislavmilic.com/portfolio/v1/01406.html
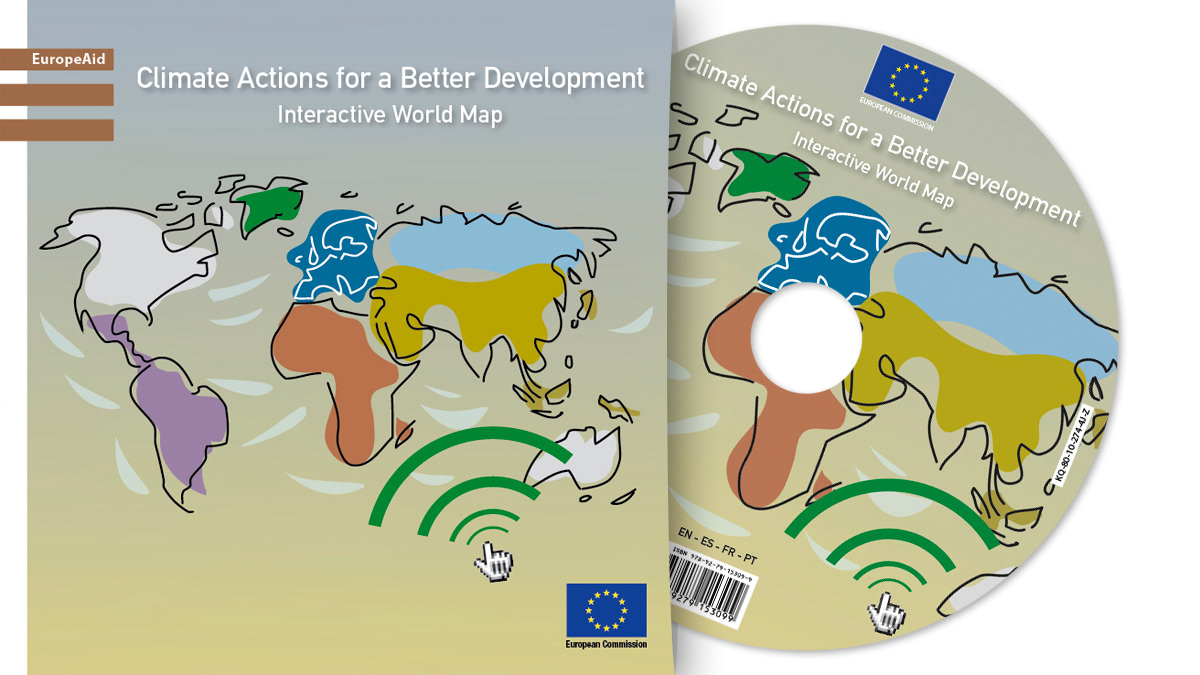
Additionally, a portable version of the map was also created as a standalone application on CDs.
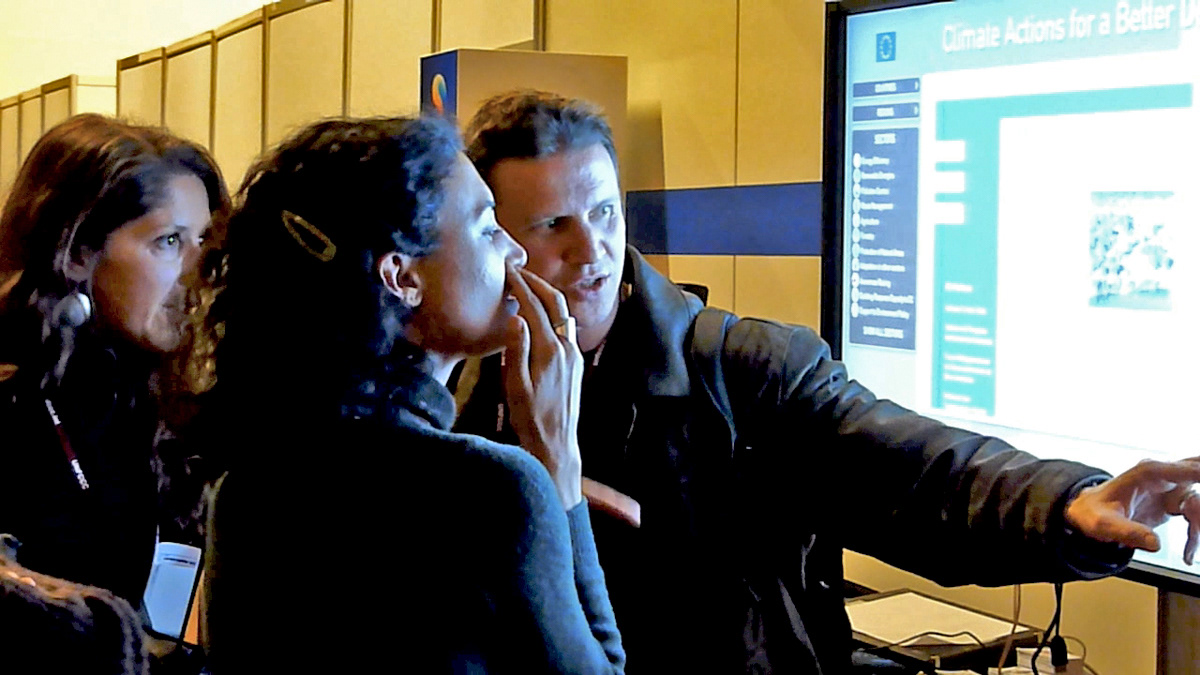
The map, which was unveiled at the Copenhagen Climate Conference in December 2009, became one of EuropeAid’s main communication tools.
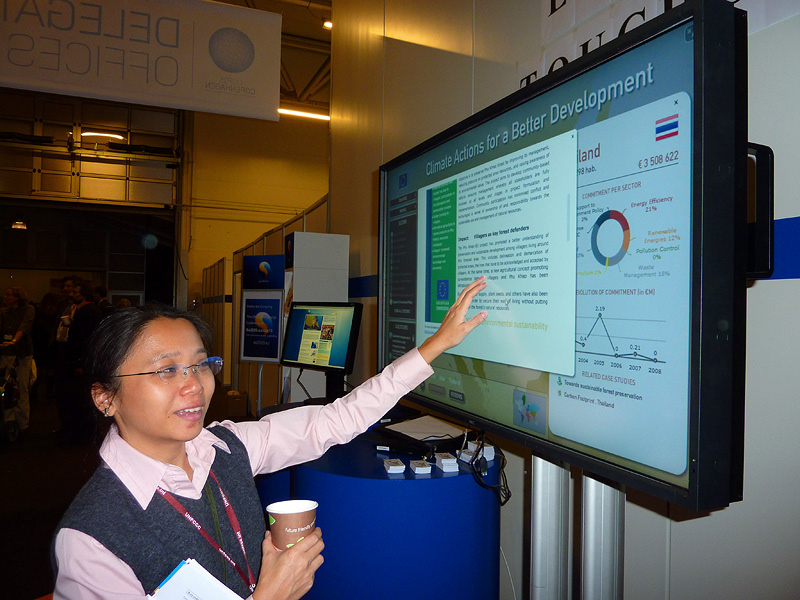
Experts in development policies were amazed by the map.
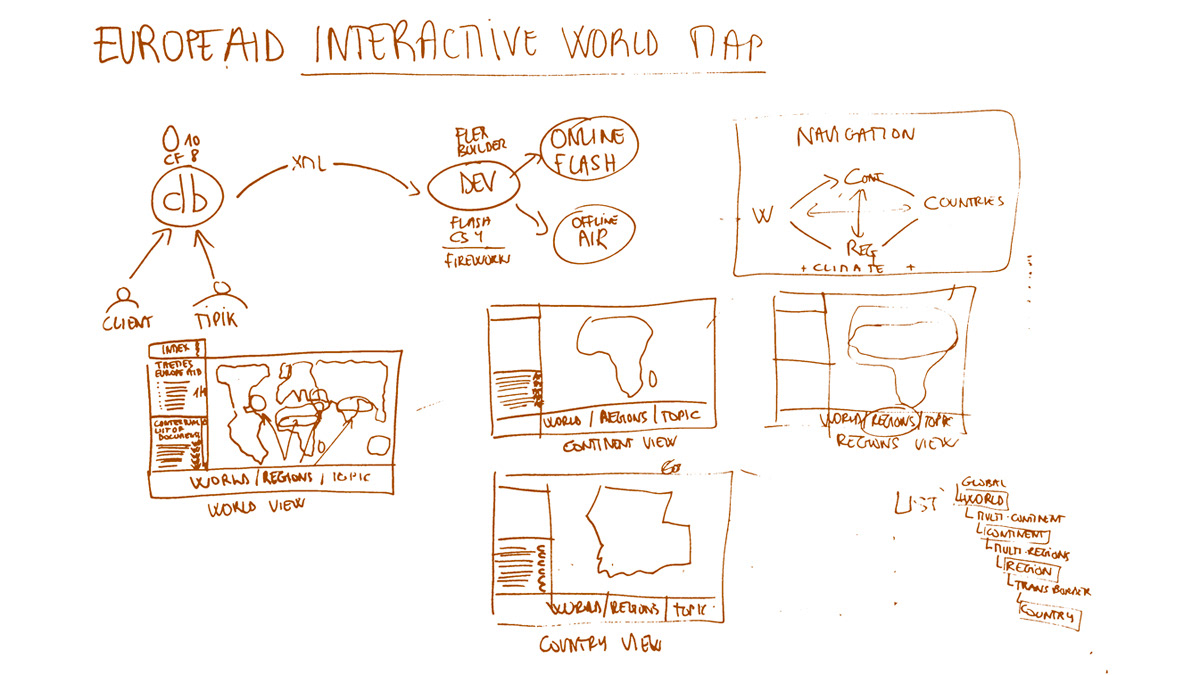
This is how everything started during a meeting: we filled in a paperboard with ideas and how we established the structure.

We created raw concepts for various UI tests.
And over a few weeks we added bricks to this huge project...
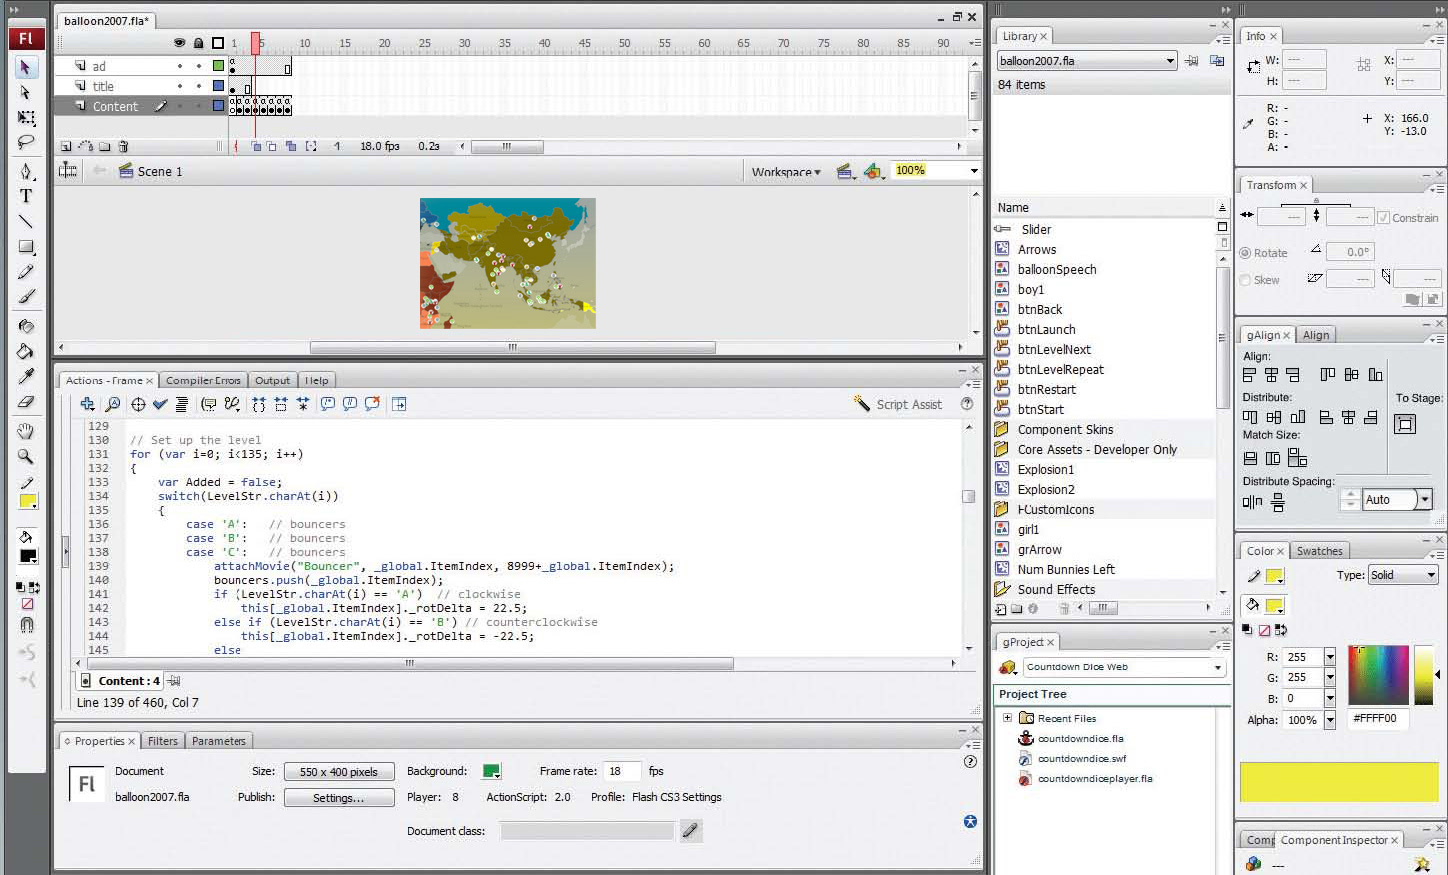
... by writing 35,000 ActionScript lines, including a series of open source components.
Keep in mind that the presentation has been developed in such a way that the client can update the content and modify some behaviour by only editing a few XML files.
Here's an example of a presentation made by the client using the engine we have provided: http://ec.europa.eu/europeaid/mdg/
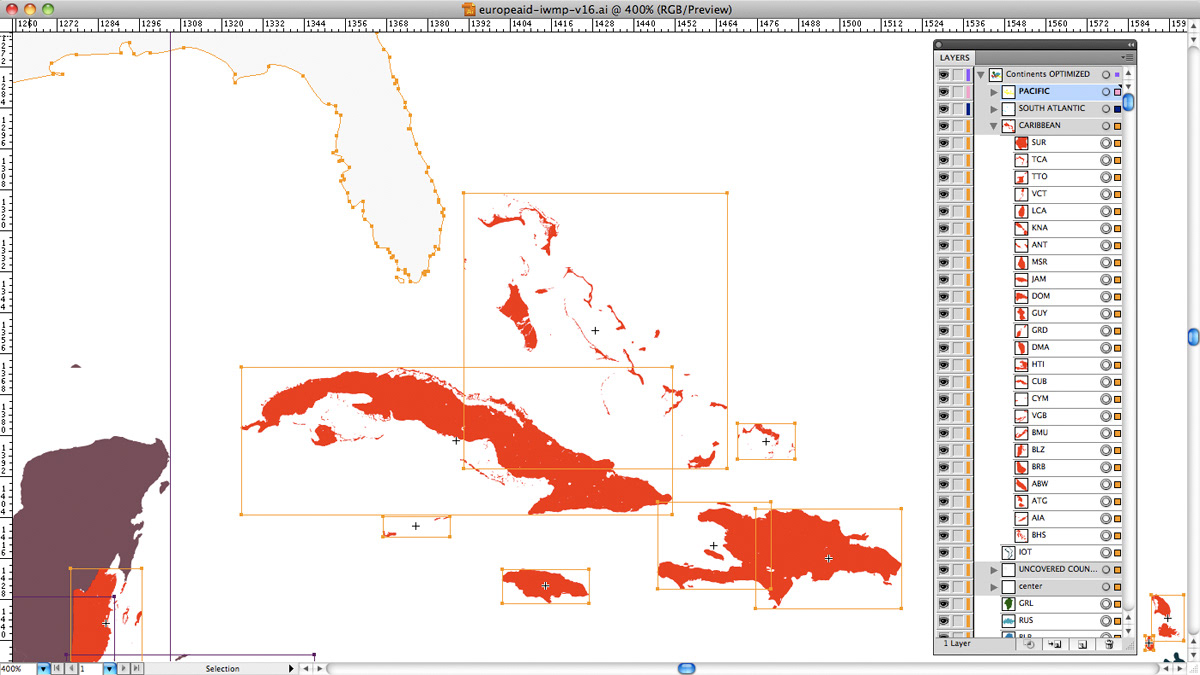
To meet technical needs, we redrew the borders of every single country and territory in the world to match a customized GPS-Mercator-grid.
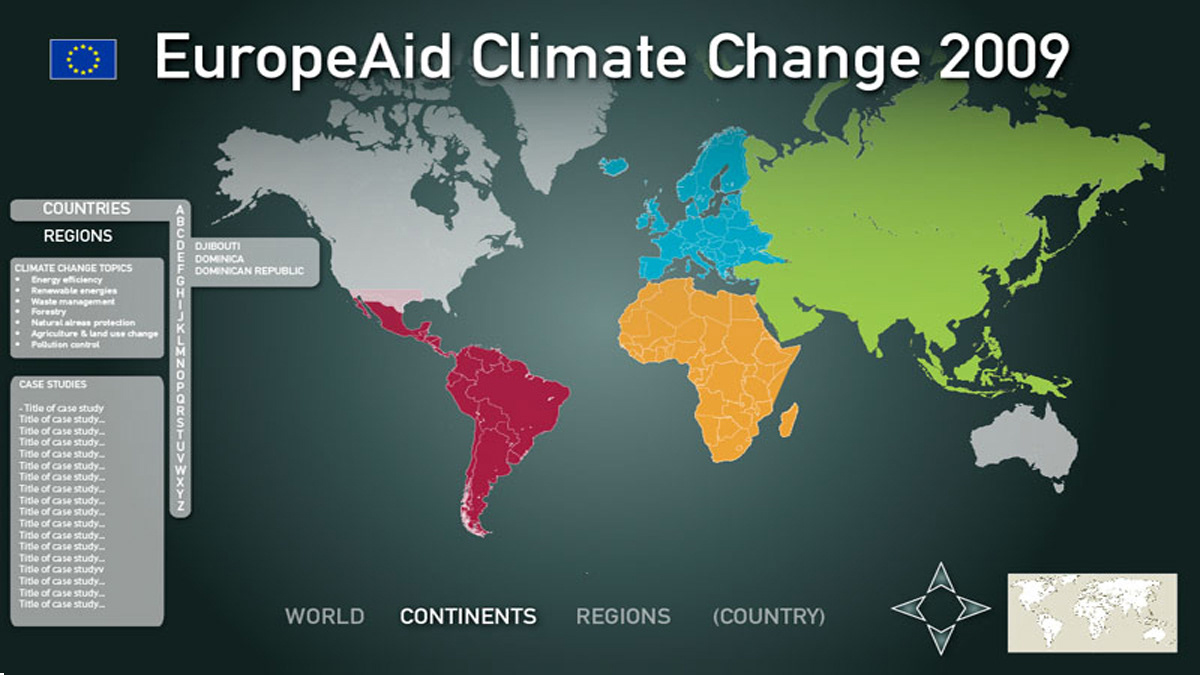
We came up with a dozen design concepts.

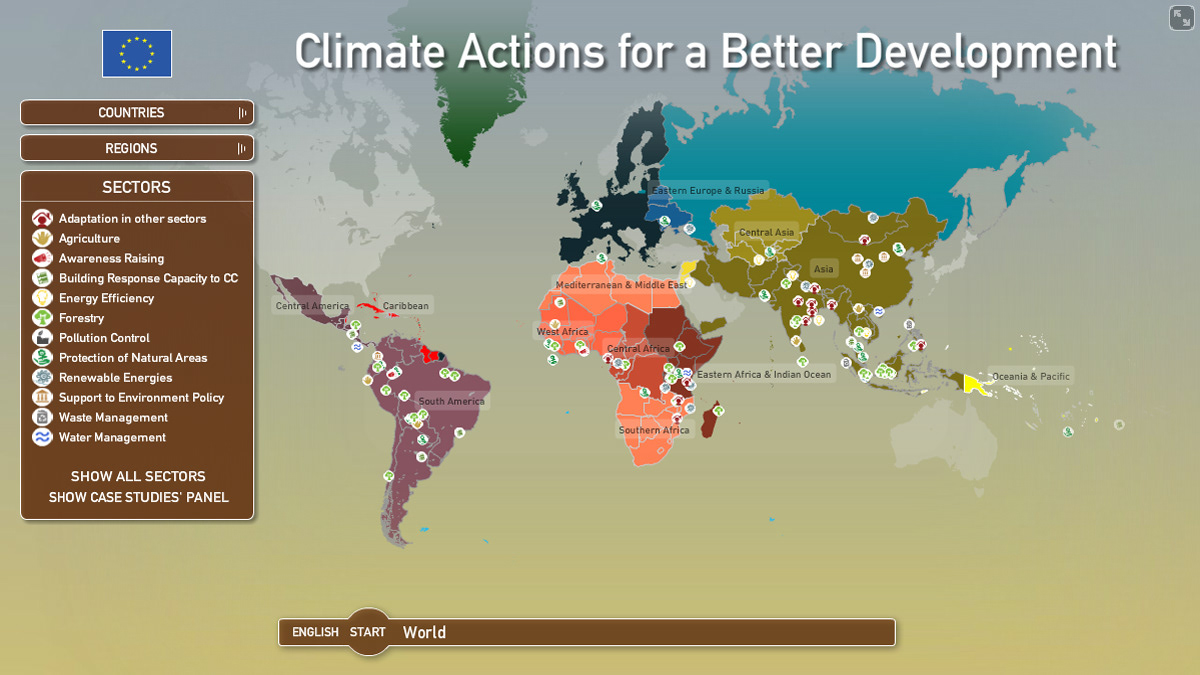
The final result.