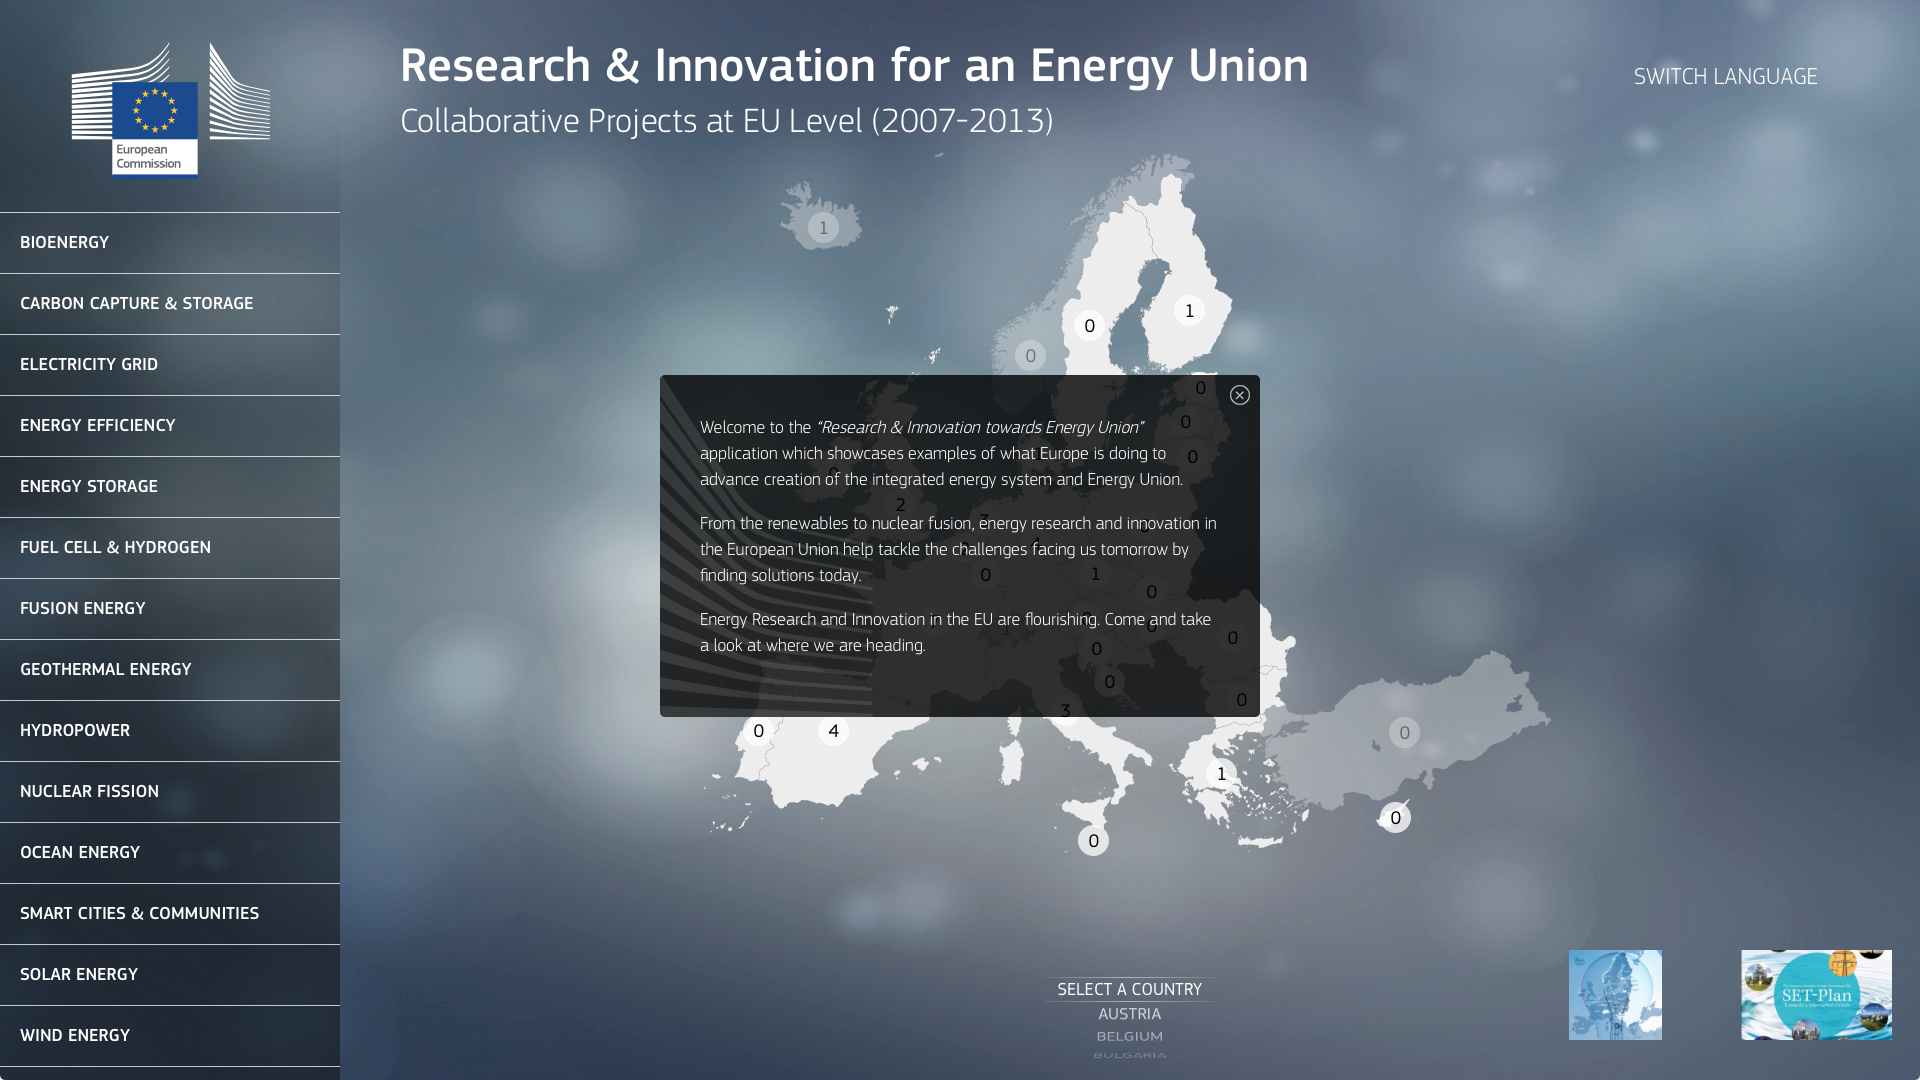
European Commission’s DG Research & Innovation needed an application for touchscreens and Web browsers to showcase examples of what Europe is doing to advance creation of the integrated energy system and Energy Union. From the renewables to nuclear fusion, energy research and innovation in the European Union help tackle the challenges facing us tomorrow by finding solutions today. (Mission for Créaset)
We have created a “soft-bokeh-style” design with a neutral gray, so the various colours of the energy and country sheets pop up in harmony. We developed also an administration panel where the client can edit the whole content: texts, images, flags, backgrounds, logos,... in 24 languages! Last but not least, this large presentation aimed for giant touchscreens has a responsive design optimized for desktop computers.
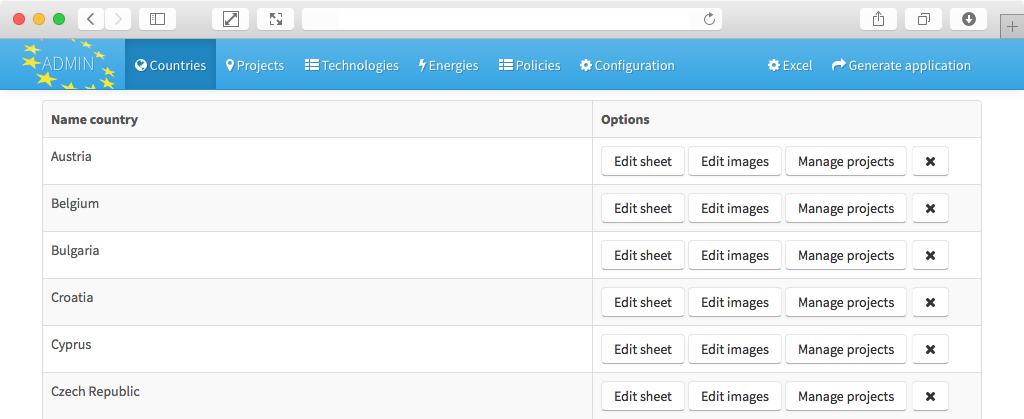
The client can edit all the data in an administration panel that we have specifically designed for this project:
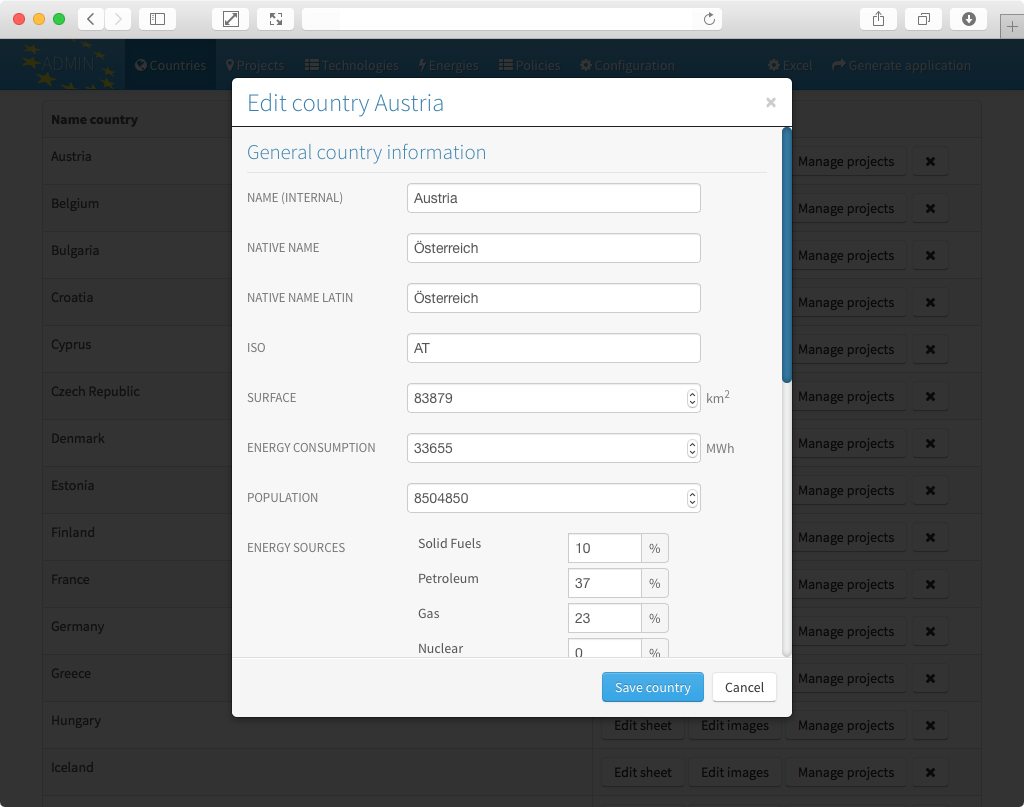
For all the energy and country sheets, a series of values are encoded and all the piecharts and sortings are automatically calculated and rendered by the app:
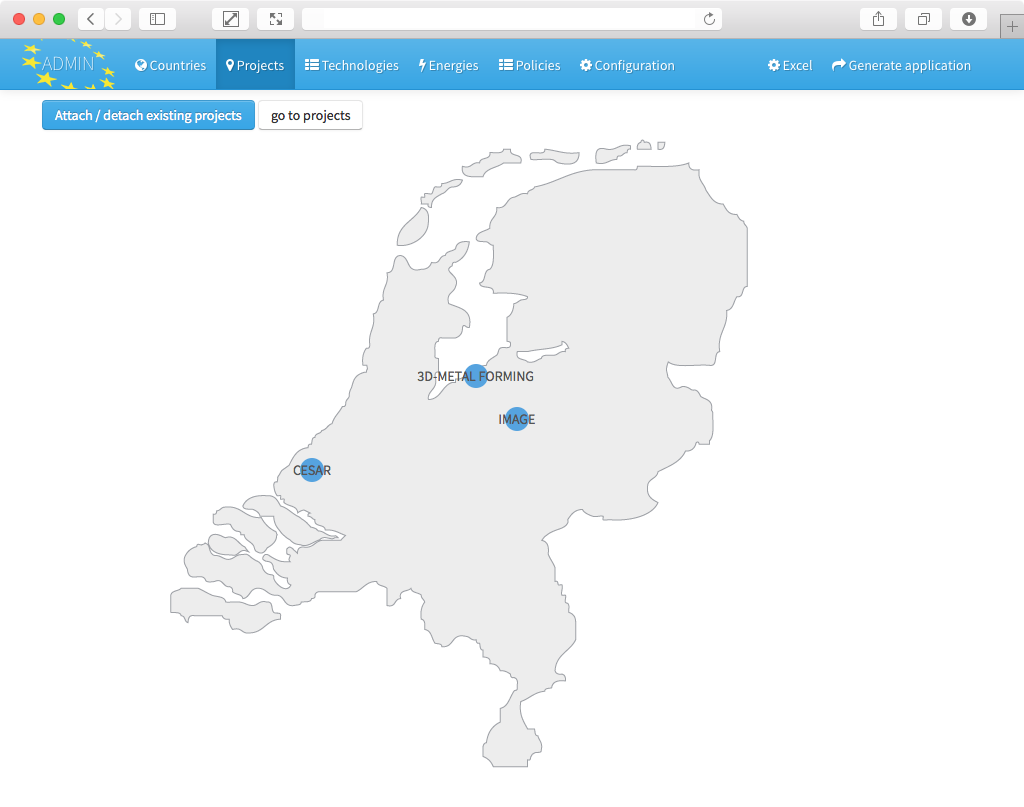
Projects are easily placed on maps by the clients with the mouse. The manual technique of positioning is better than the automatic position with GPS coordinates where the risk of having projects overlapping each other is higher:
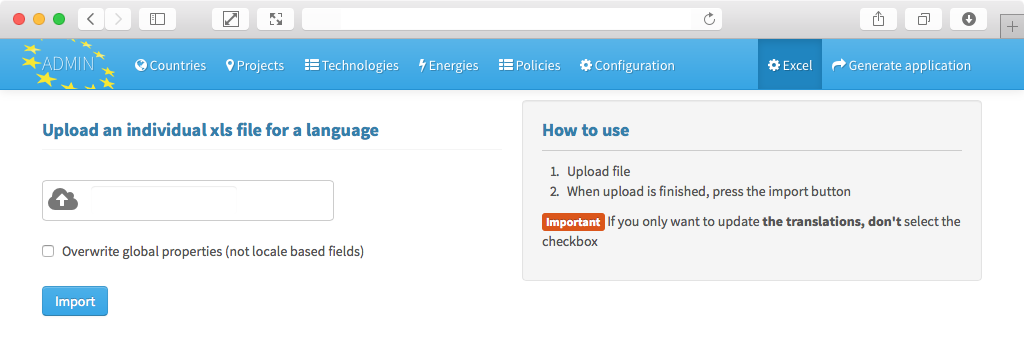
Batch-filling data is also possible, especially for translations, with a custom Excel parser:
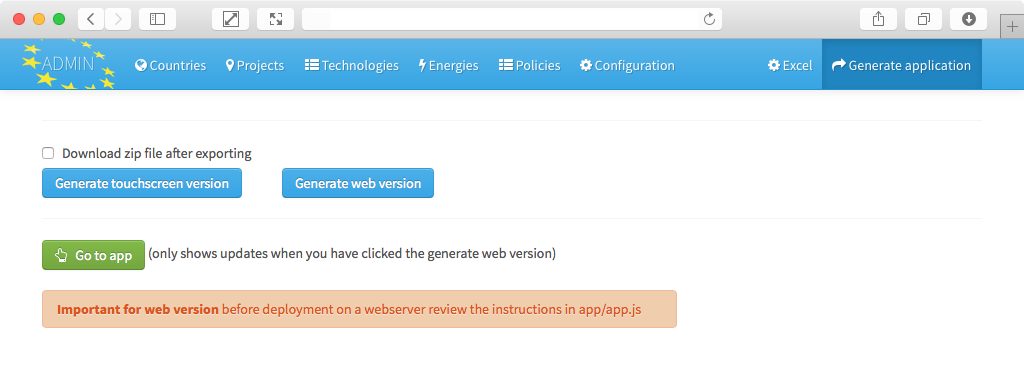
Once editing is finished, the client generates the touchscreen version and the Web version of the presentation.
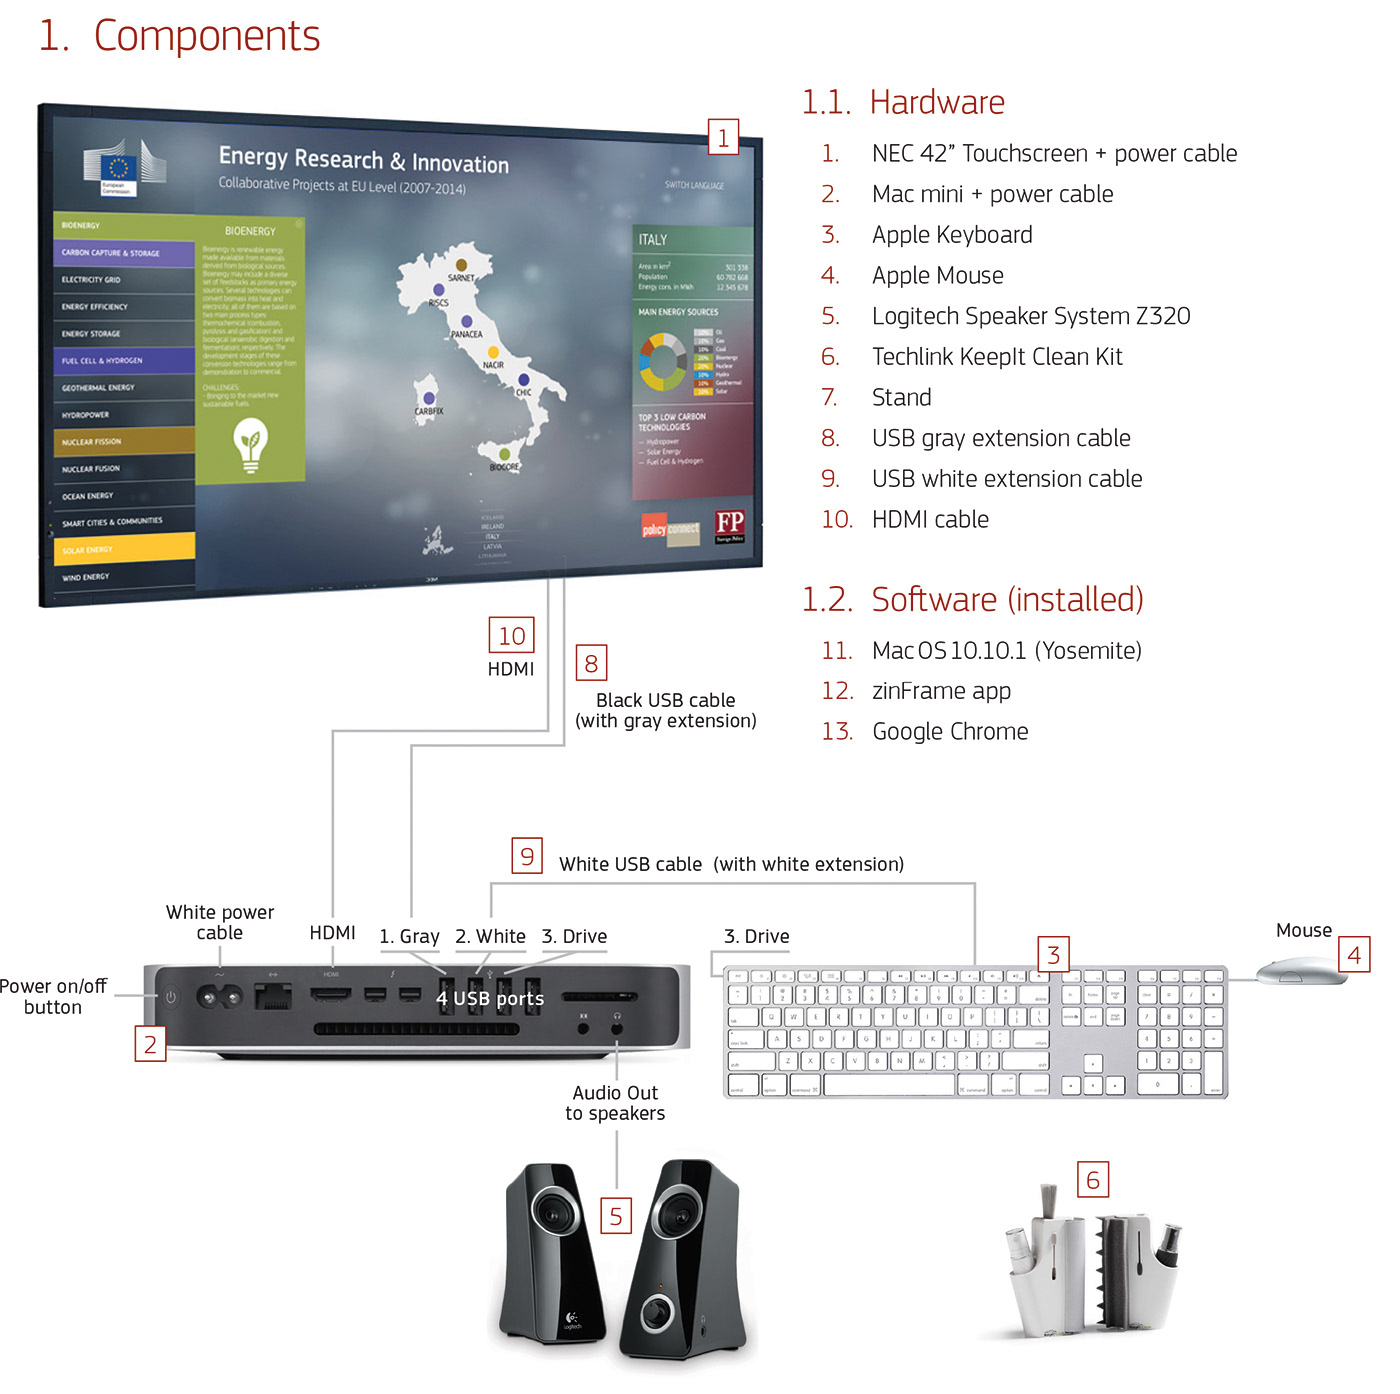
The administration panel generates a special version of the presentation for touchscreens. The client needs just to copy the folder on the Mac mini hooked to the NEC touchscreen that we have set up, and to double-click a file.
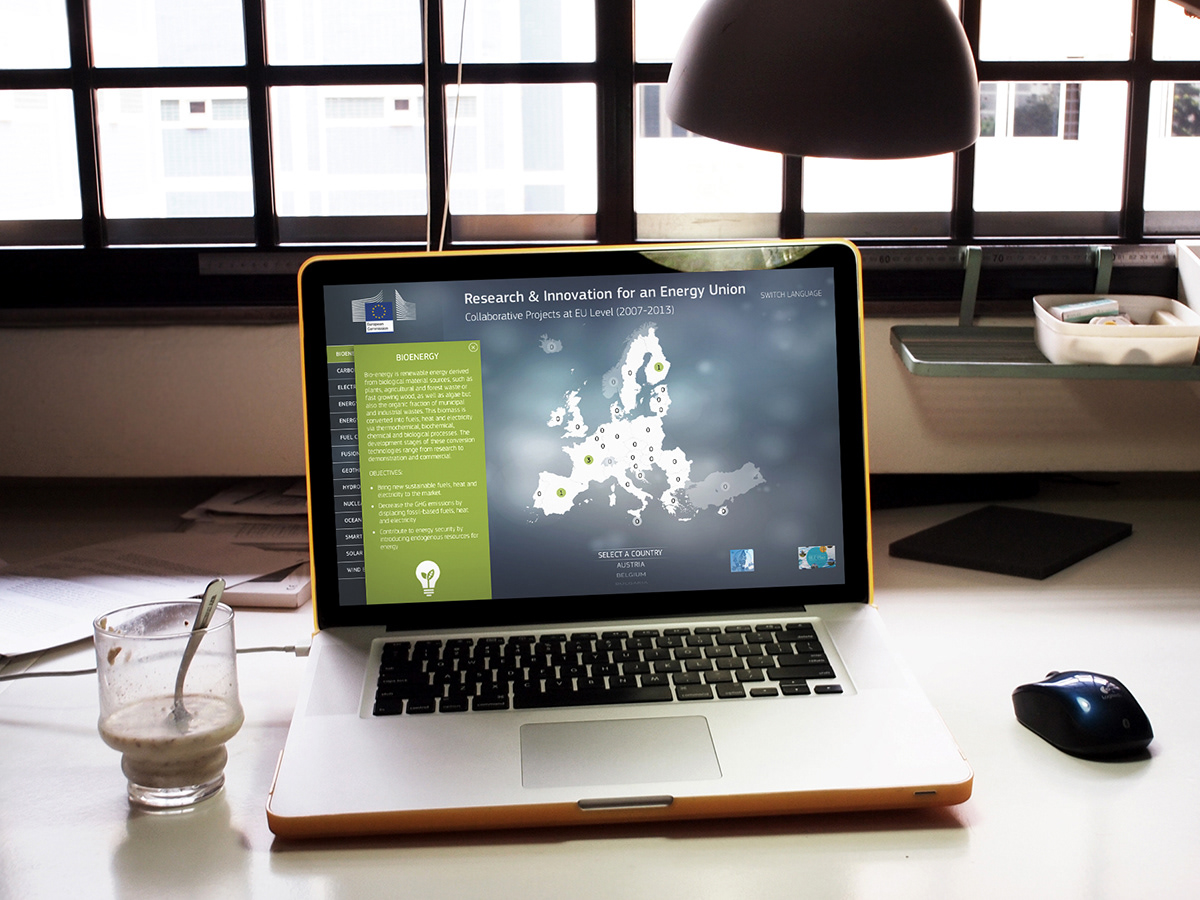
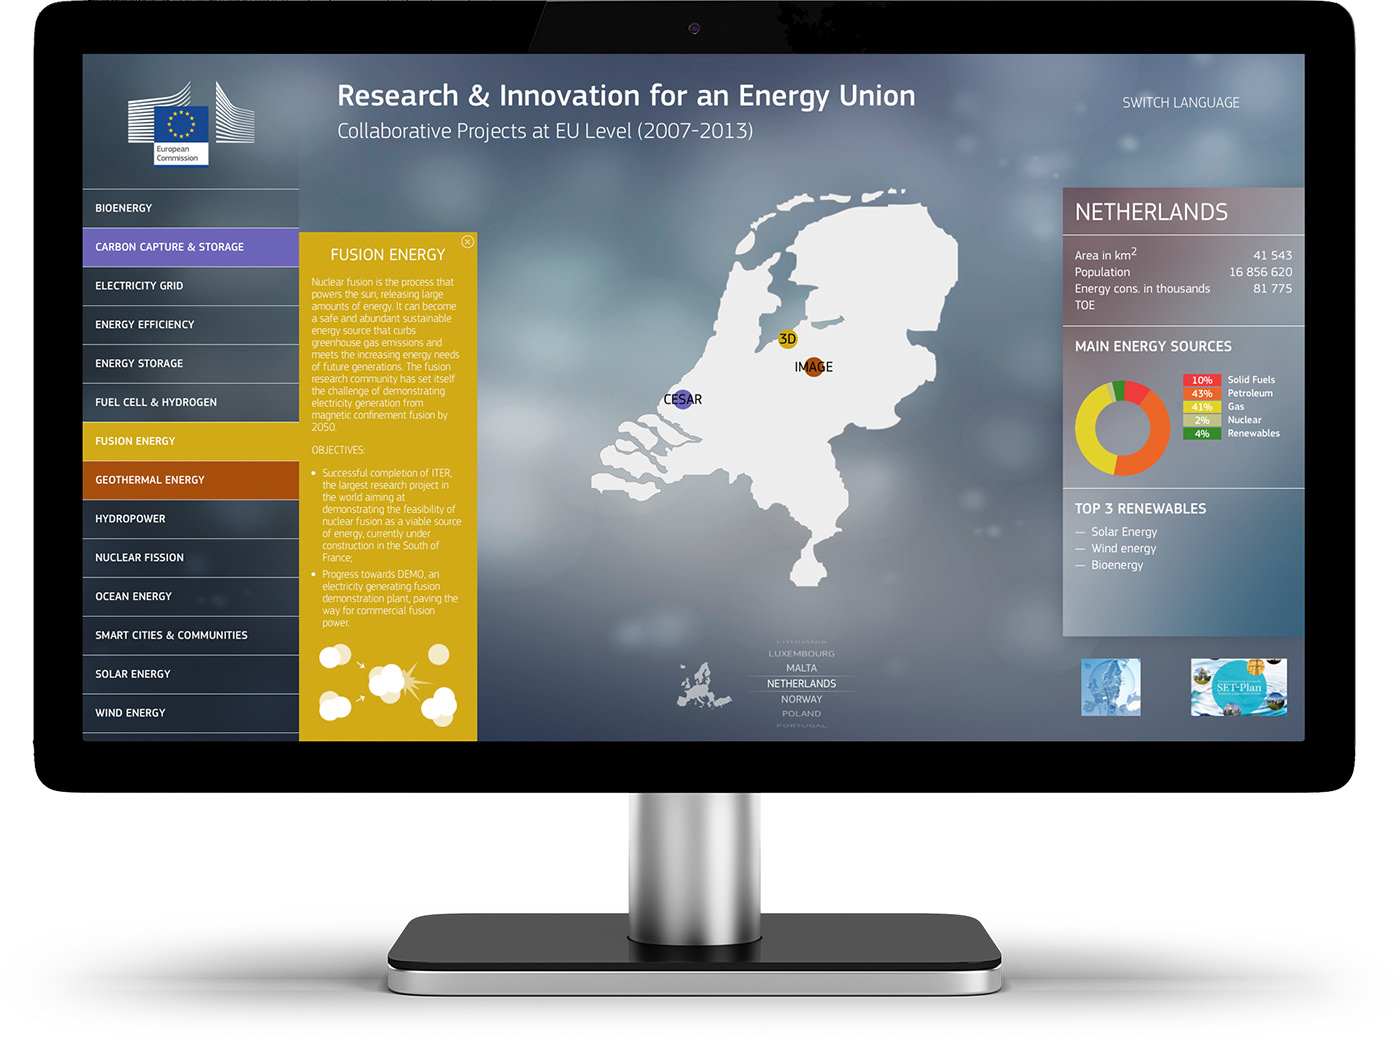
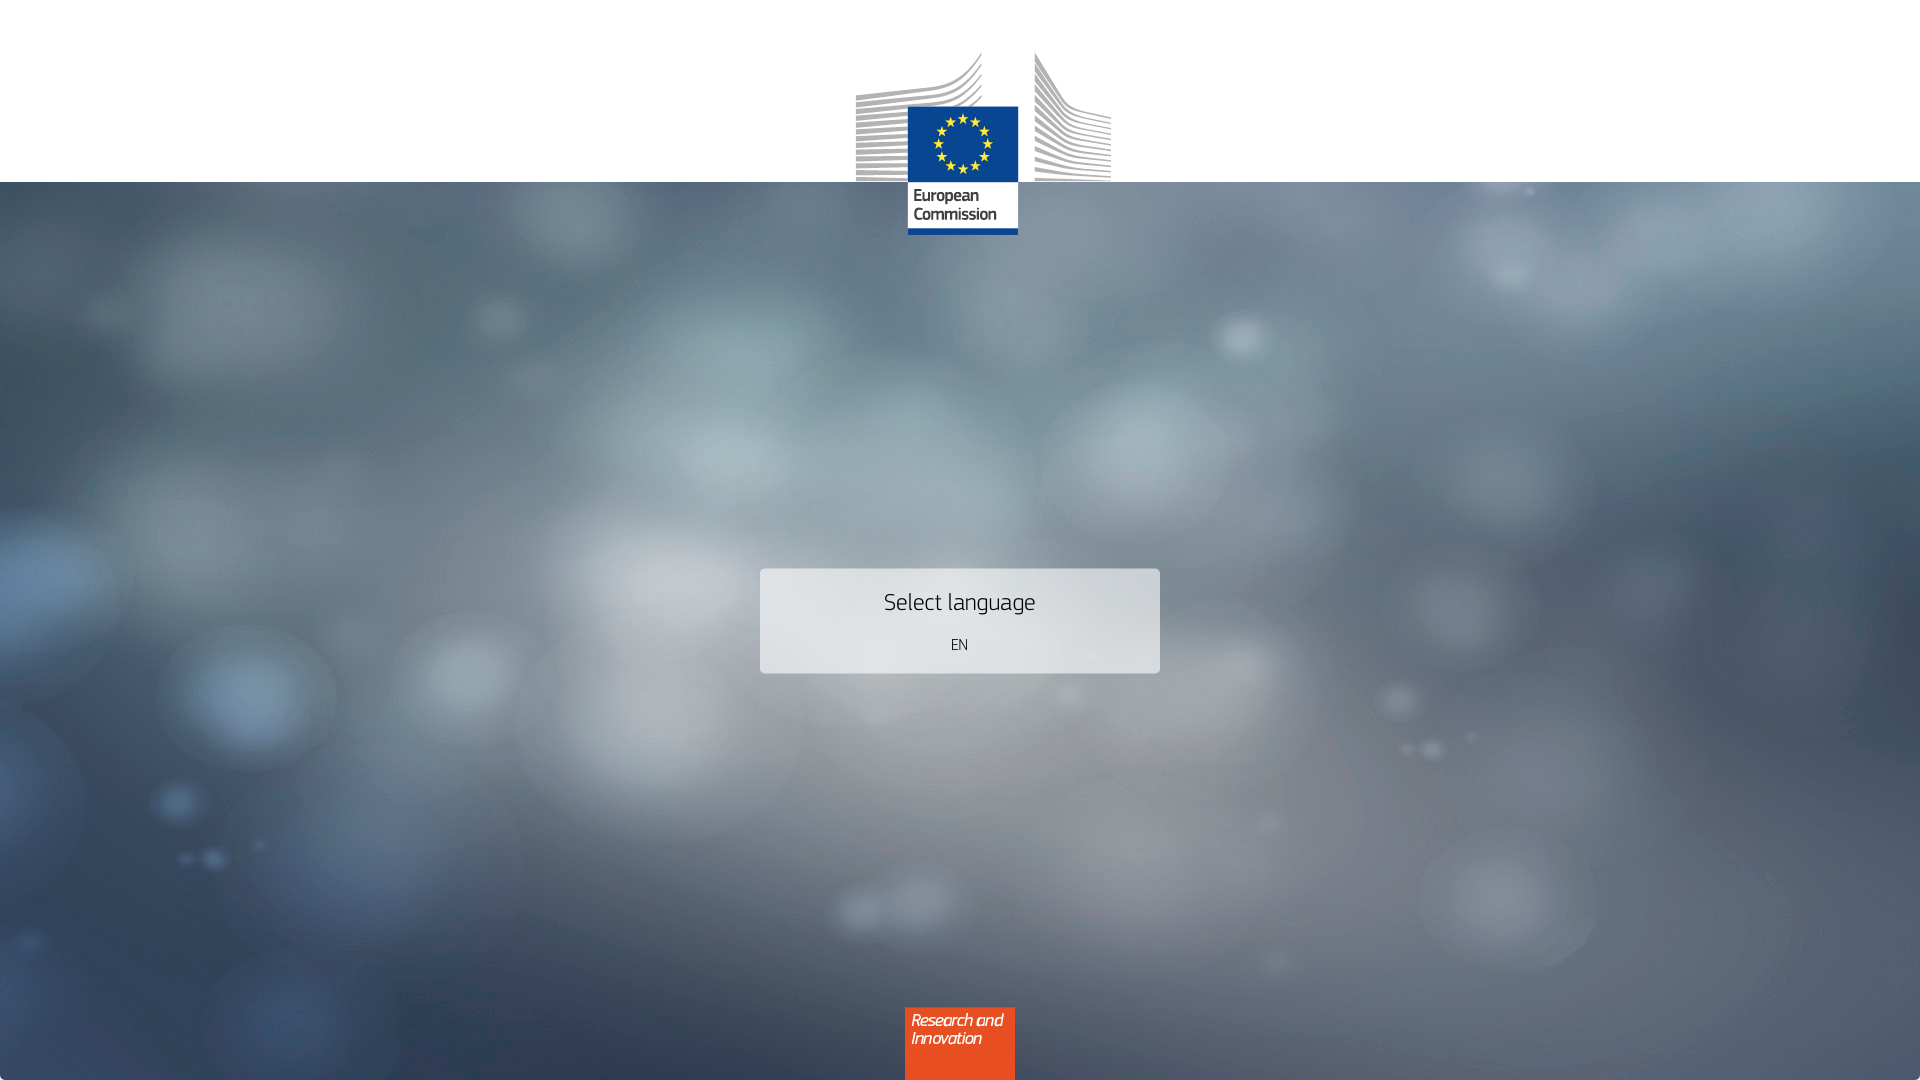
When the presentation is launched, the user is prompted to choose the language. Currently only the English version is visible but there are virtually no limits in how many languages can be added in the presentation. Switching languages is easy by just tapping the “SWITCH LANGUAGE” text in the upper right corner — the user is then sent back to the welcome screen.
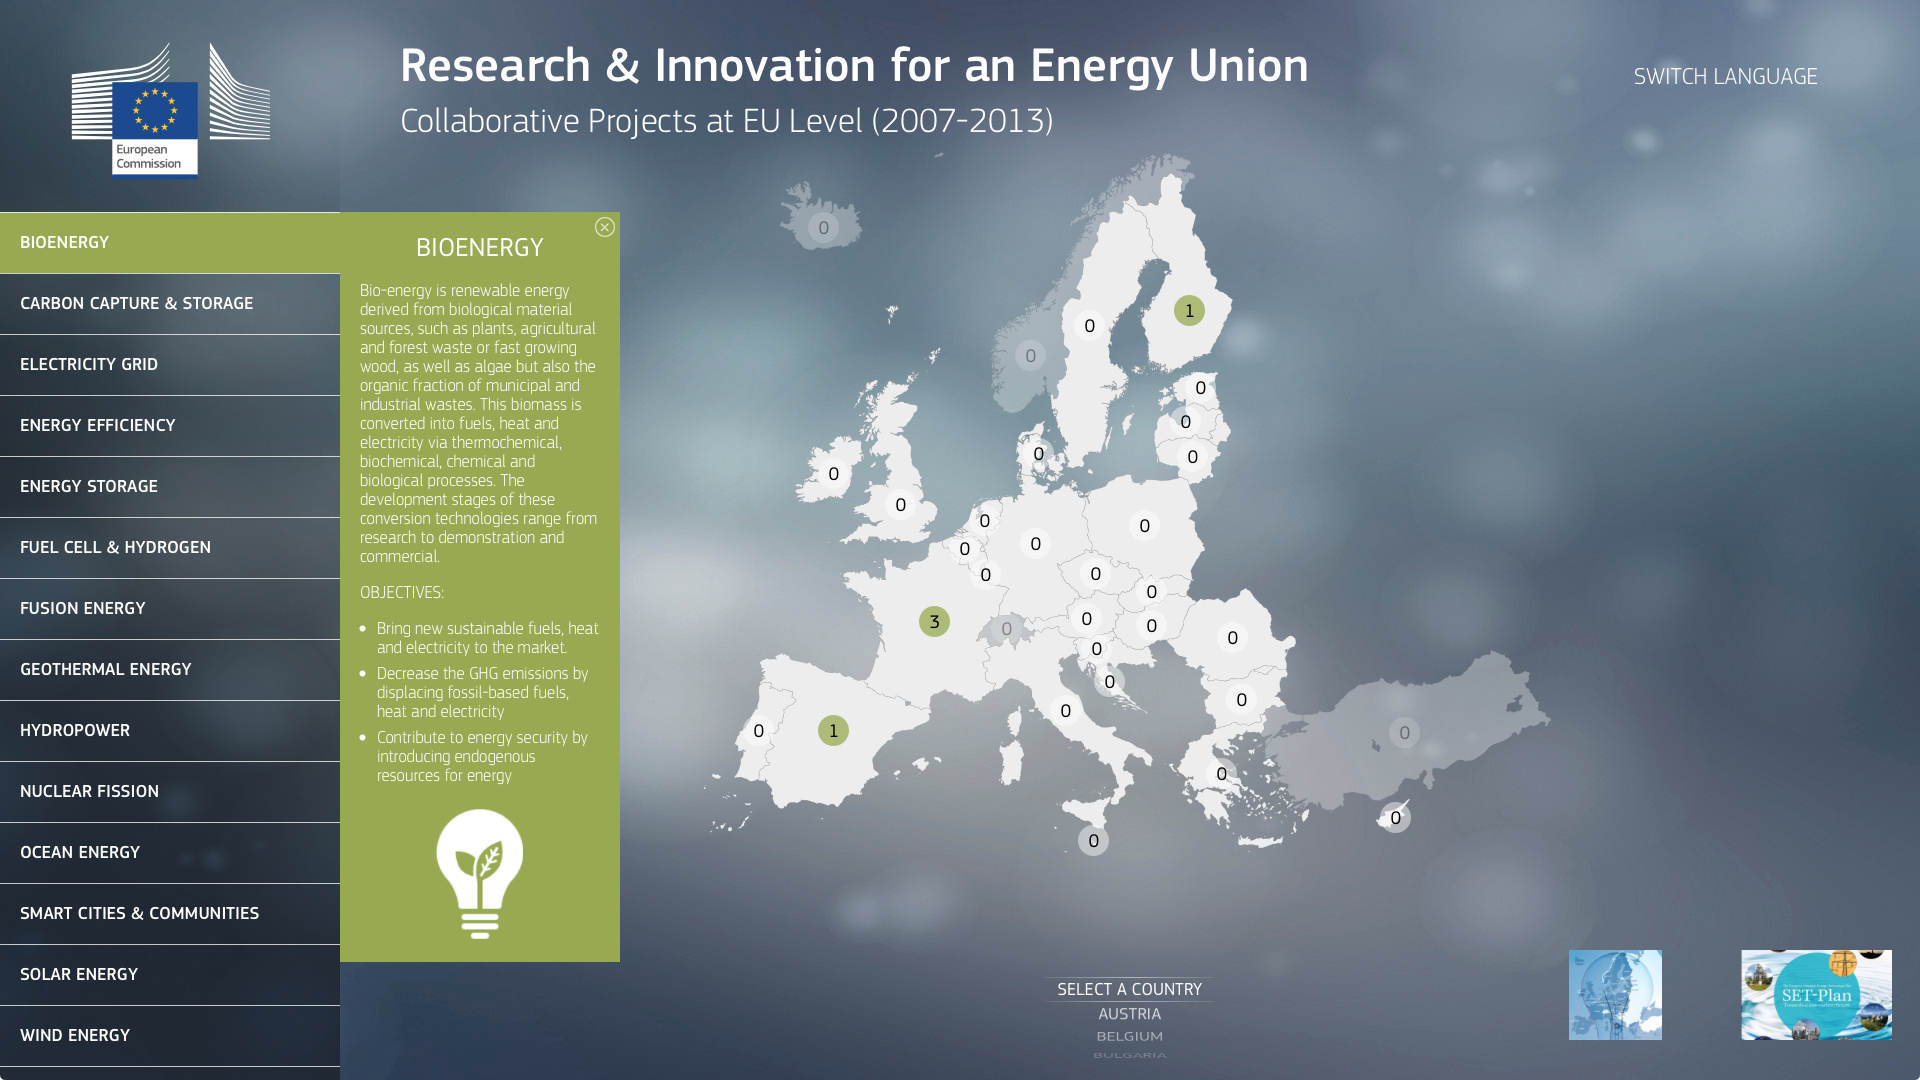
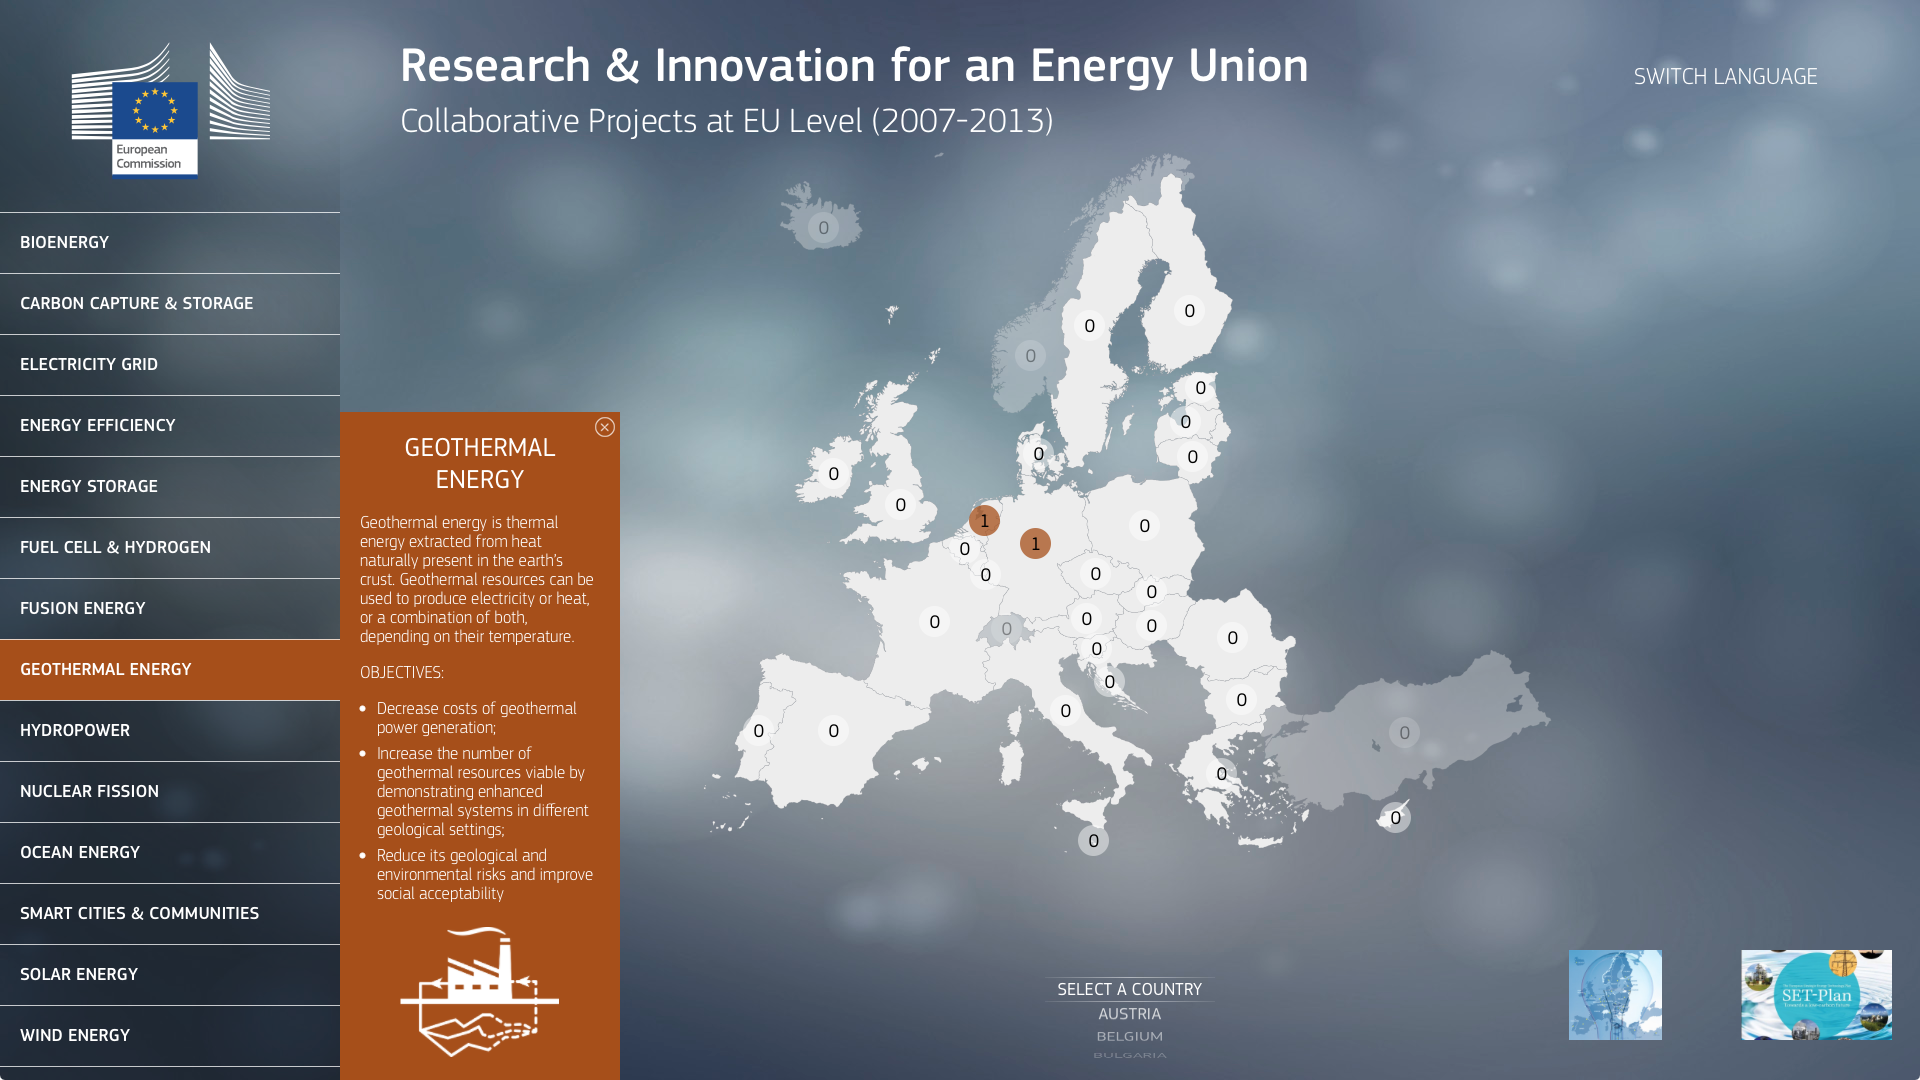
On the left side: the list of energy technologies. By taping the name of a technology, a description appears.
When a technology is selected, the map of Europe is filtered and we see only the number of projects using that technology in some countries.
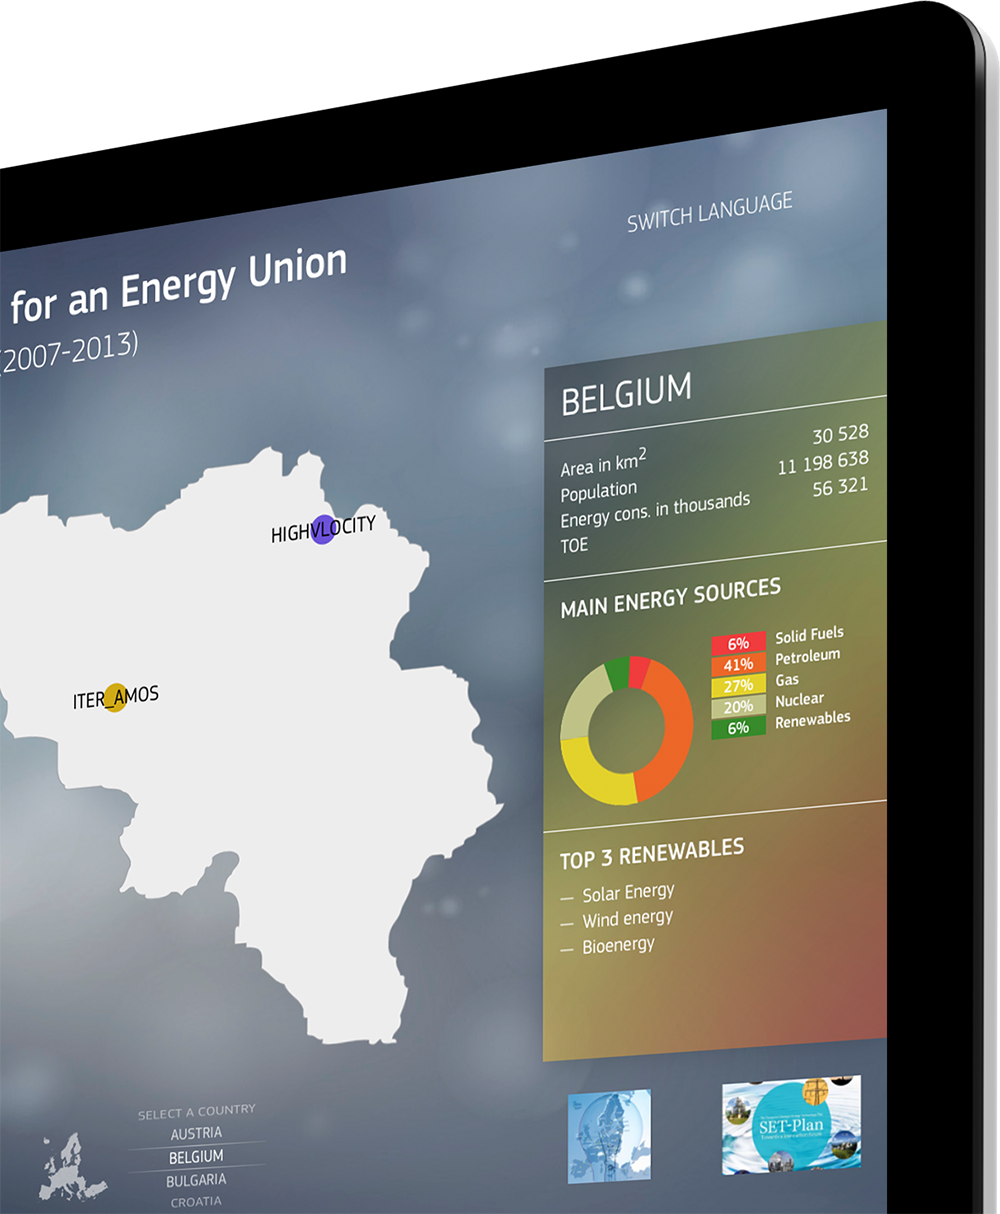
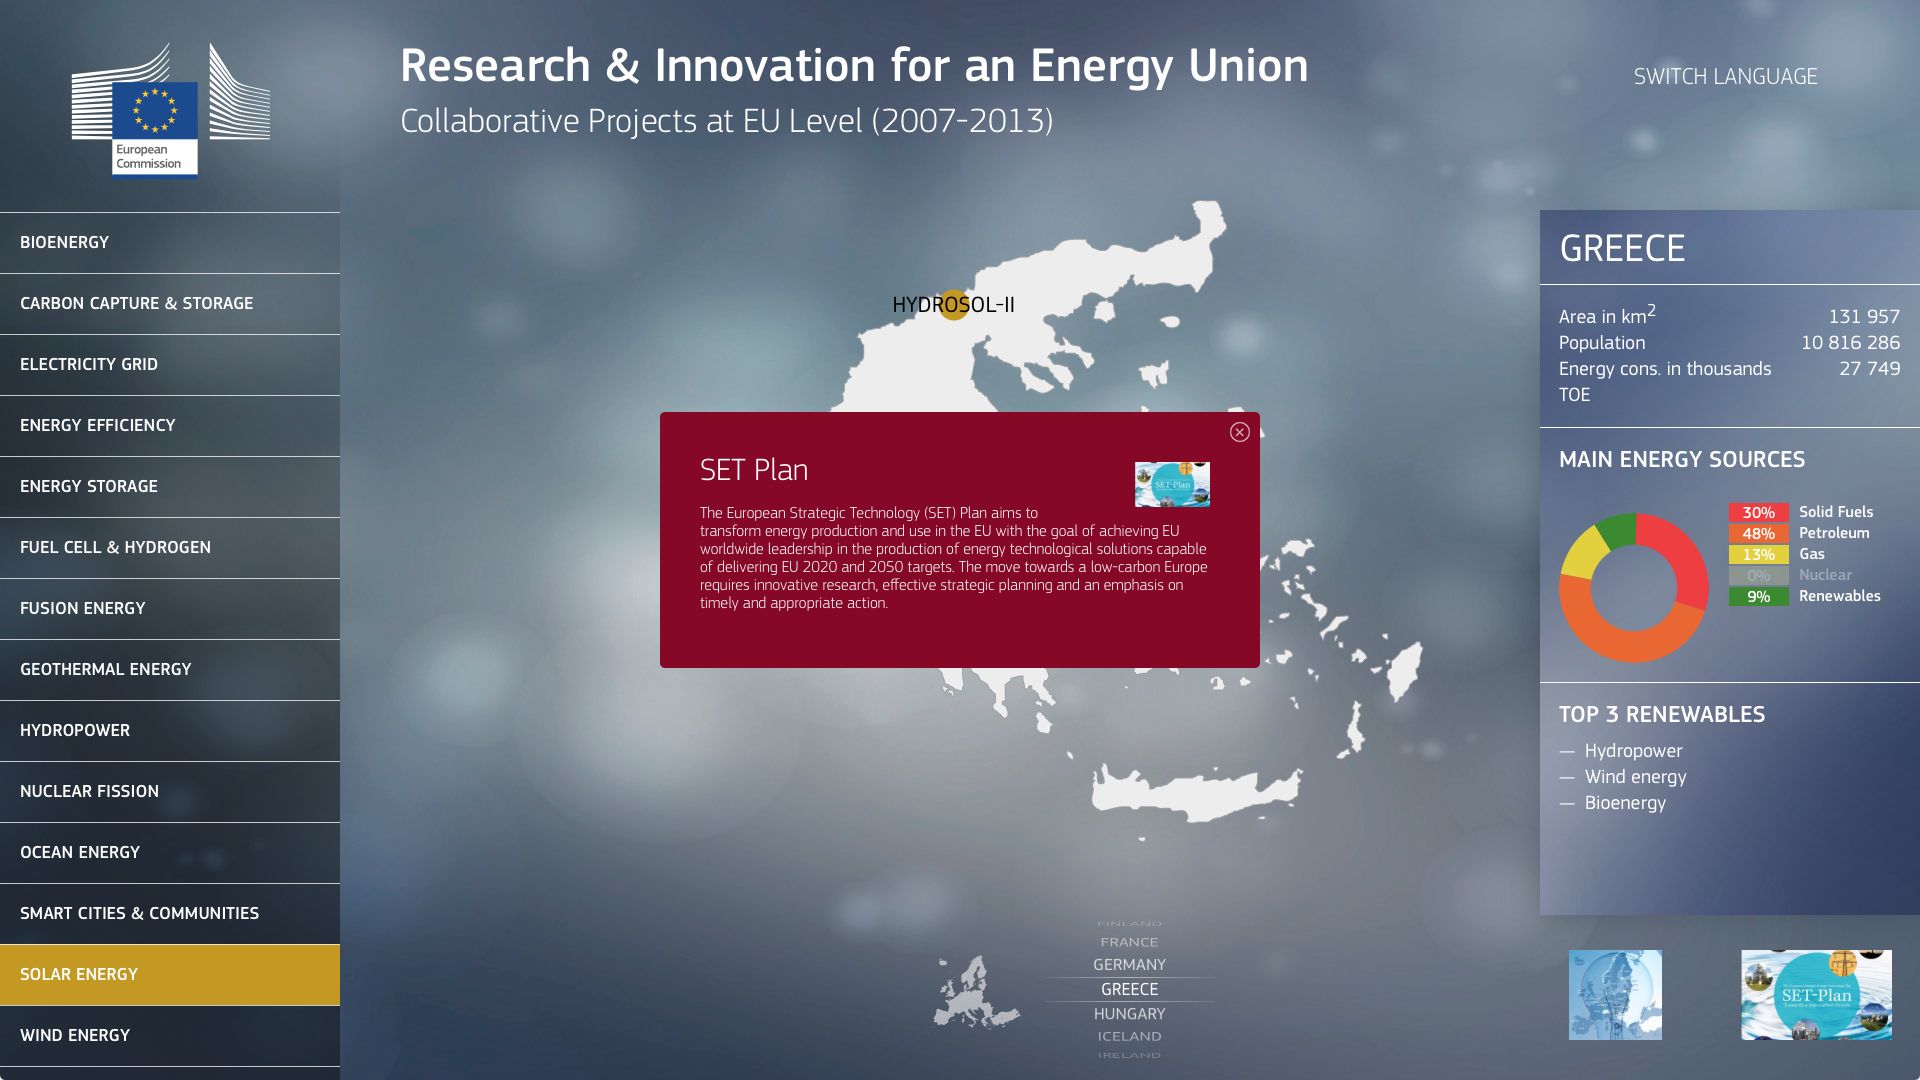
When the user taps on a country on the map of Europe, that country is displayed along a sheet with a background containing a blurry version of the national flag. All the data comes from the administration panel and the piechart is rendered on-the-fly.
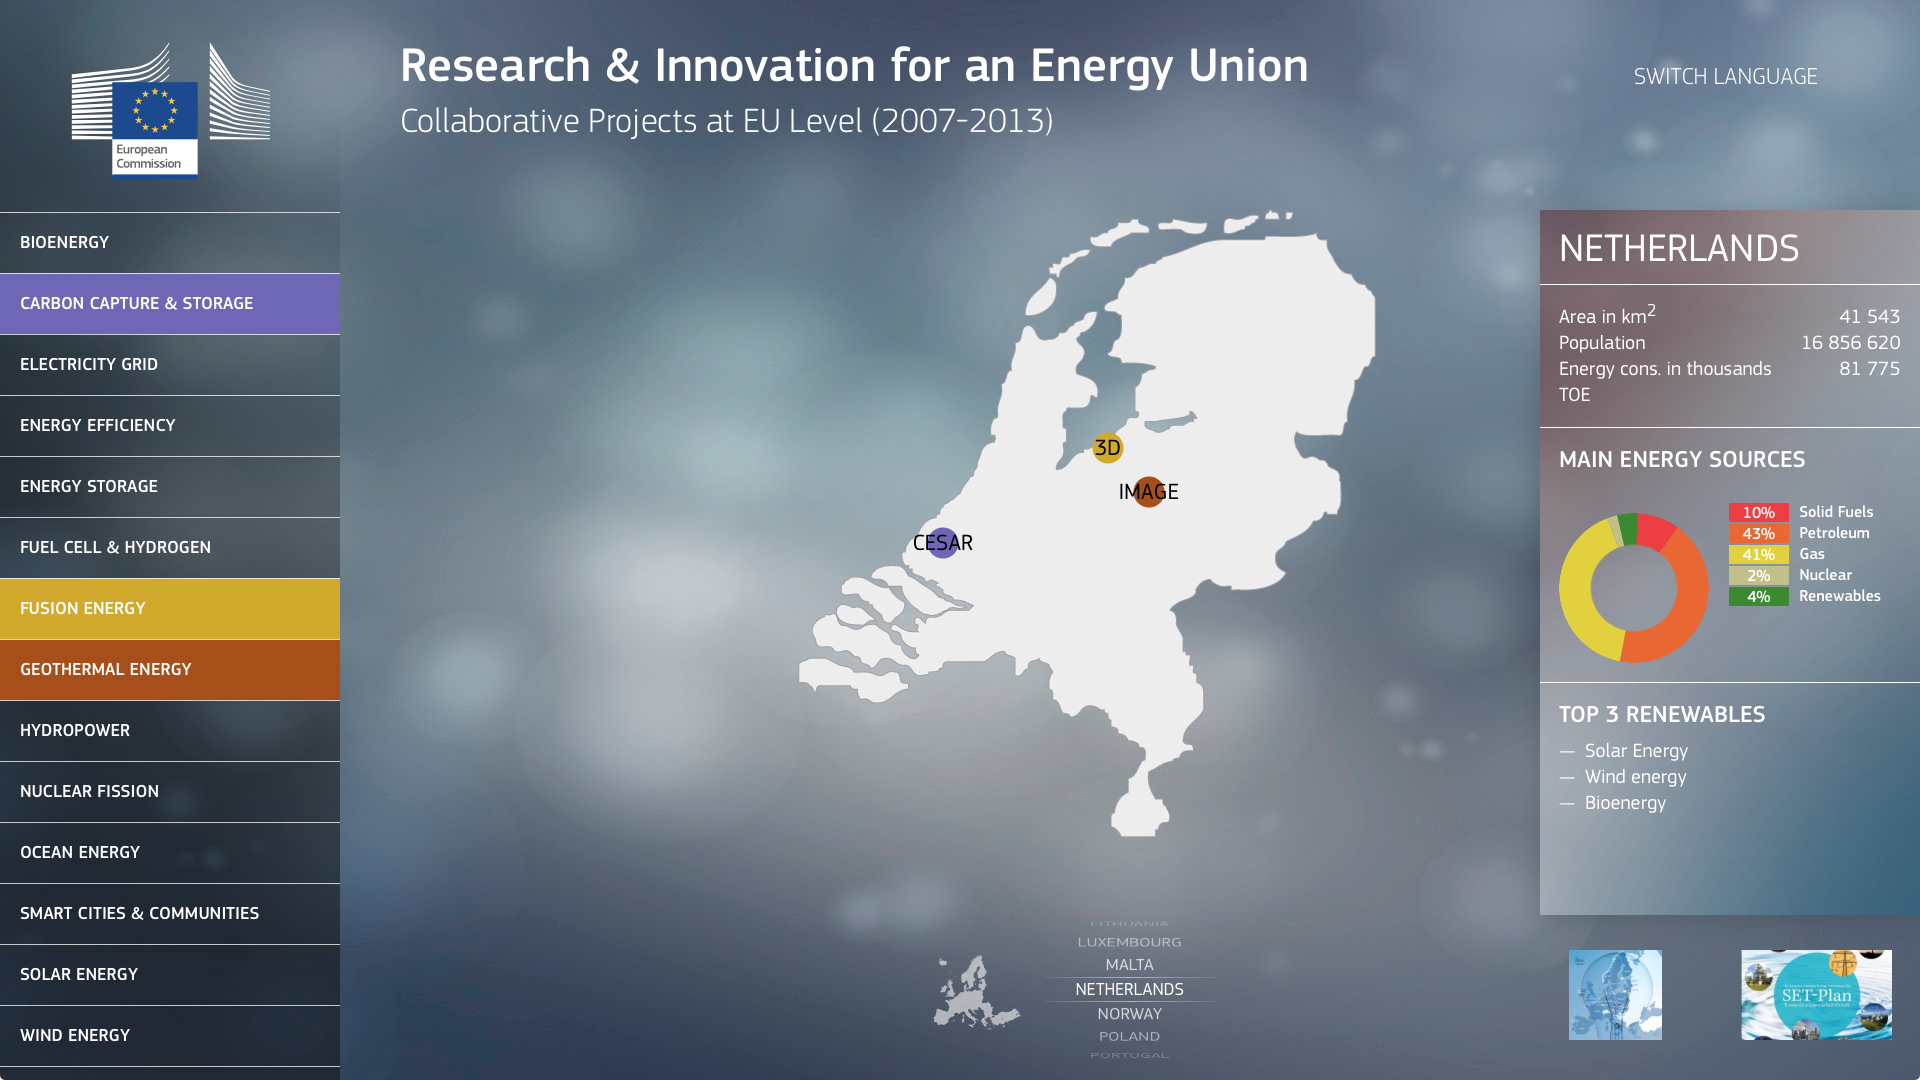
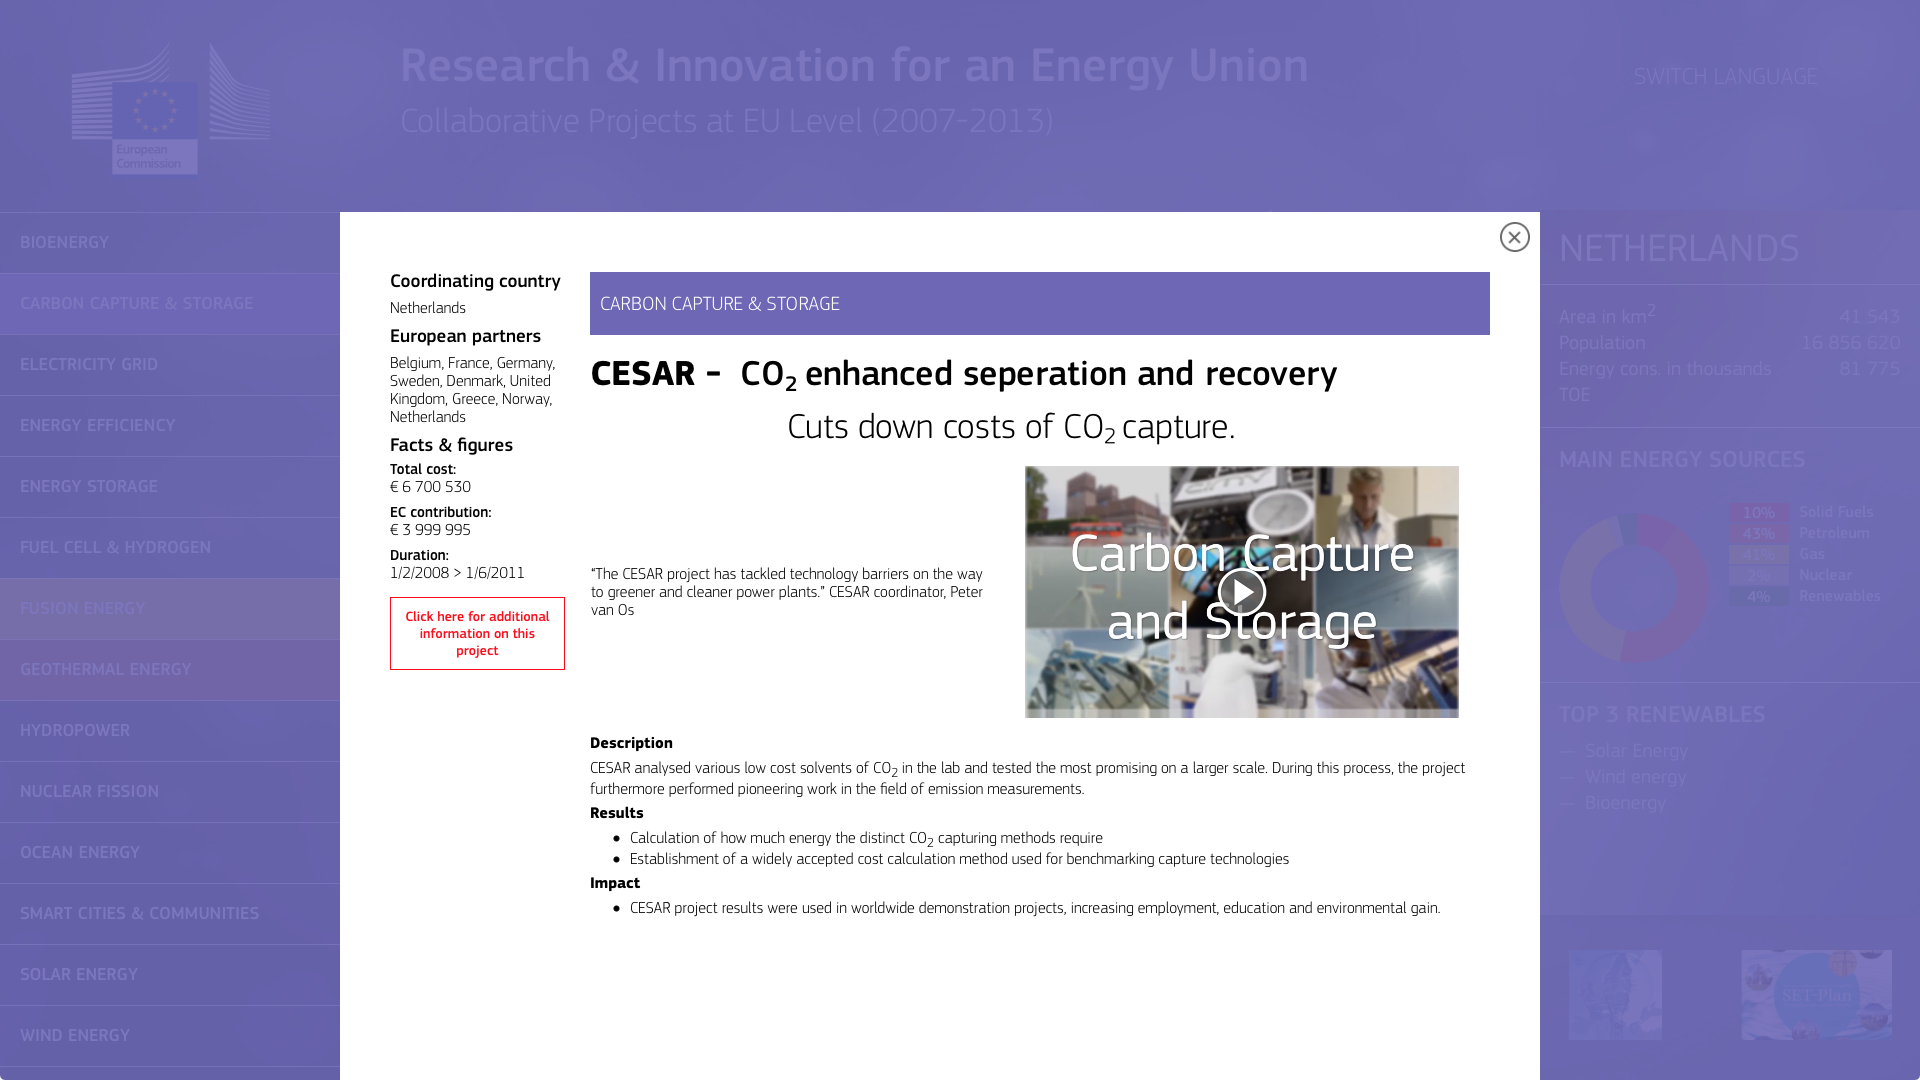
When the user taps on a project on the country's map, a lightbox covers the whole presentation and displays relevant information about this project with statitistics and, for some projects, a slideshow or a movie. If available, even the slideshows and the movies can be specific for each language.
At any time the user may come back on the map of Europe. Selecting another country can also be done using the nifty carousel that we have developed with specific codes for the touchscreen version and for the Web (mouse) version. Watch the 24-second video for a demo:
Additional information on some European policies and programs can be read by tapping the logos in the lower right corner. The client manages also by him/herself the content and the layout of these logos and datasheets.
The Web version of the presentation is also design-responsive for destkop screens.
And after reading all this page, your reward is to finally take a look at the Web version right HERE!
Please note that the main purpose of this presentation is to be visible on large touchscreens. The Web version has not yet been fully optimized for all kinds of screen ratios or sizes. Try to set your browser's window to 1920 x 1080 px.